Marketing Results: Google Analytics Behavior Tracking
Marketers-at-large spend billions of dollars in an effort to convert their brand audience into foot traffic at physical points of purchase. In our industry – builders & developers face unique challenges as competition for homebuyer attention can be high in the face of many choices, busy lives & a growing aversion to traditional sales methods.
The Marketers challenge:
Reach > Engage > Connect
In service of this objective, the effectiveness of your website should be judged partially on its effectiveness at:
- Engagement
- Conversion
MapsPLUS can play a unique role in helping you to engage your audience with a unique visual story and connect to prospects through measured lead capture. Through its integration with Google Analytics – MapsPLUS can deliver understanding of your online customer’s journey and clear steps necessary to optimize lead capture.
MapsPLUS | Google Analytics Integration
The Google Analytics tool-set is incredibly powerful and using on it on your website is essential to gaining insight into where your website is working for you. With a typical MapsPLUS map application located on a single URL, what are the ways in which we can we get the most relevant Analytics data about our user’s interaction? The key is to use Google’s event tracking, goals, and funnels, to paint an accurate picture of your visitor behavior.
So what kinds of things can we track with events? Anything that you can track with an on-page JavaScript event, and in combination, any event in connection with the Google Maps API. This includes clicks on lots, zoom changes, hover events, and more.
To make things easier, we’ve integrated the core events into the MapsPLUS STARTER CODE – so it comes ready-to-enable right out of the box. We’ve created the ability to track an event with Google Analytics, one line of code can be added within to the JavaScript event. For example, if a button were clicked, using jQuery, your code would look something like this:
$('#my-button').click(function()
{
  //Track the event.
  ga('send', 'event', 'button', 'click', 'Button Clicked');
});
This tracking code accepts the following arguments:
ga(‘send’, ‘event’, category, action, label, value);
The first two arguments are required and indicate that you are tracking an event. The category and action argument are also are required, and customizable to how you’d like to see your data organized within Analytics. Finally, the label and value arguments are also optional. More information about event tracking and these arguments can be found here:
https://developers.google.com/analytics/devguides/collection/analyticsjs/events
Goals
Goals are also incredible useful with Analytics. By setting up goals, you can associate each of your events with a goal. For example, if you were to consider an Ajax “Thank you” message from a contact form to be a goal, you can set up an event (within the Ajax success) to track when your form has been successfully submitted. Similarly, if you wanted to create a goal for every time a lot info dialog was opened, you could add a goal for that as well.
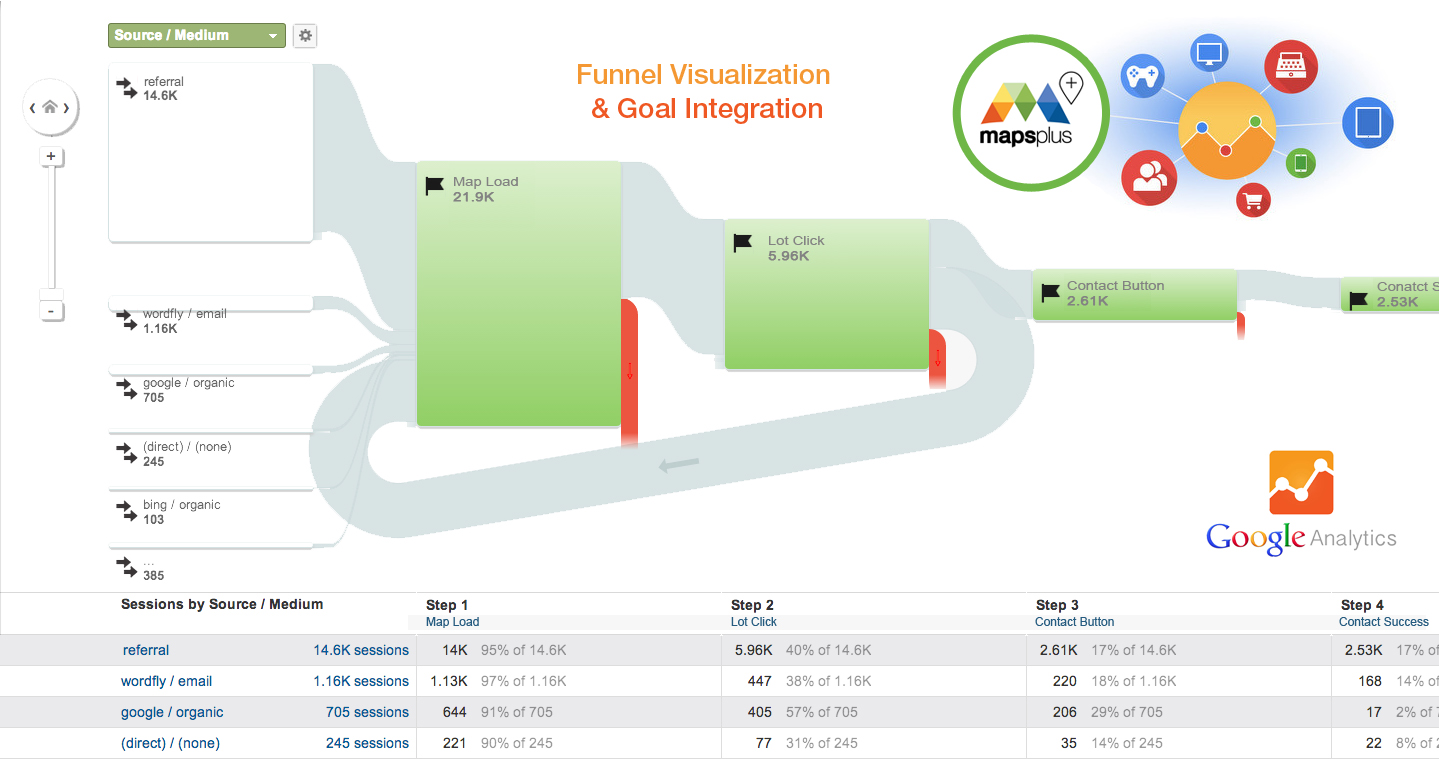
Funnels
Google Analytics’ Funnels give you the ability to create steps associated with your goals. This allows you to see the success rate of each page and helps you determine where you might be losing your user’s interest. With respect to our MapsPLUS maps, you can use funnels with goals that you create with goals of type “Destination” (where your goal is an actual URL destination), however, it is currently not possible to create a funnel on a goal that is entered as an “Event” (a button click, etc.) In some cases, such as our MapsPLUS map, you may indeed want some of your user interaction with maps to be defined as goals. As a workaround, you can use Google’s virtual page views as an alternative. Instead of using an “Event” goal, create a “Destination” goal, and use the following code to track a virtual page view:
ga(‘send’, ‘pageview’, ‘/maps/community_1/lot_clicked’);
This would be used instead of the event tracking code used with event tracking. Similarly, each step in your funnel toward this goal would use a virtual page view. The downside to using this approach is that these virtual page views will add to your overall page views, which may create misleading results in your reports.
Yes, MapsPLUS maps are typically located on one page, but don’t let that deter you from using Google Analytics to gain valuable information about your visitors.